The Countries dashboard in the Semrush Traffic & Market Toolkit shows which countries drive the most traffic to any competitor or market domain you analyze. It helps you compare international performance, uncover global trends, and identify where a site’s audience is concentrated.
Use this dashboard to benchmark against competitors, explore geographic traffic patterns, and refine country-specific strategies.
Getting started with the Countries dashboard
The Get Started menu is your entry point into the Semrush Traffic & Market Toolkit. It’s designed to help you quickly enter domains and move into your analysis of their traffic and marketing performance.
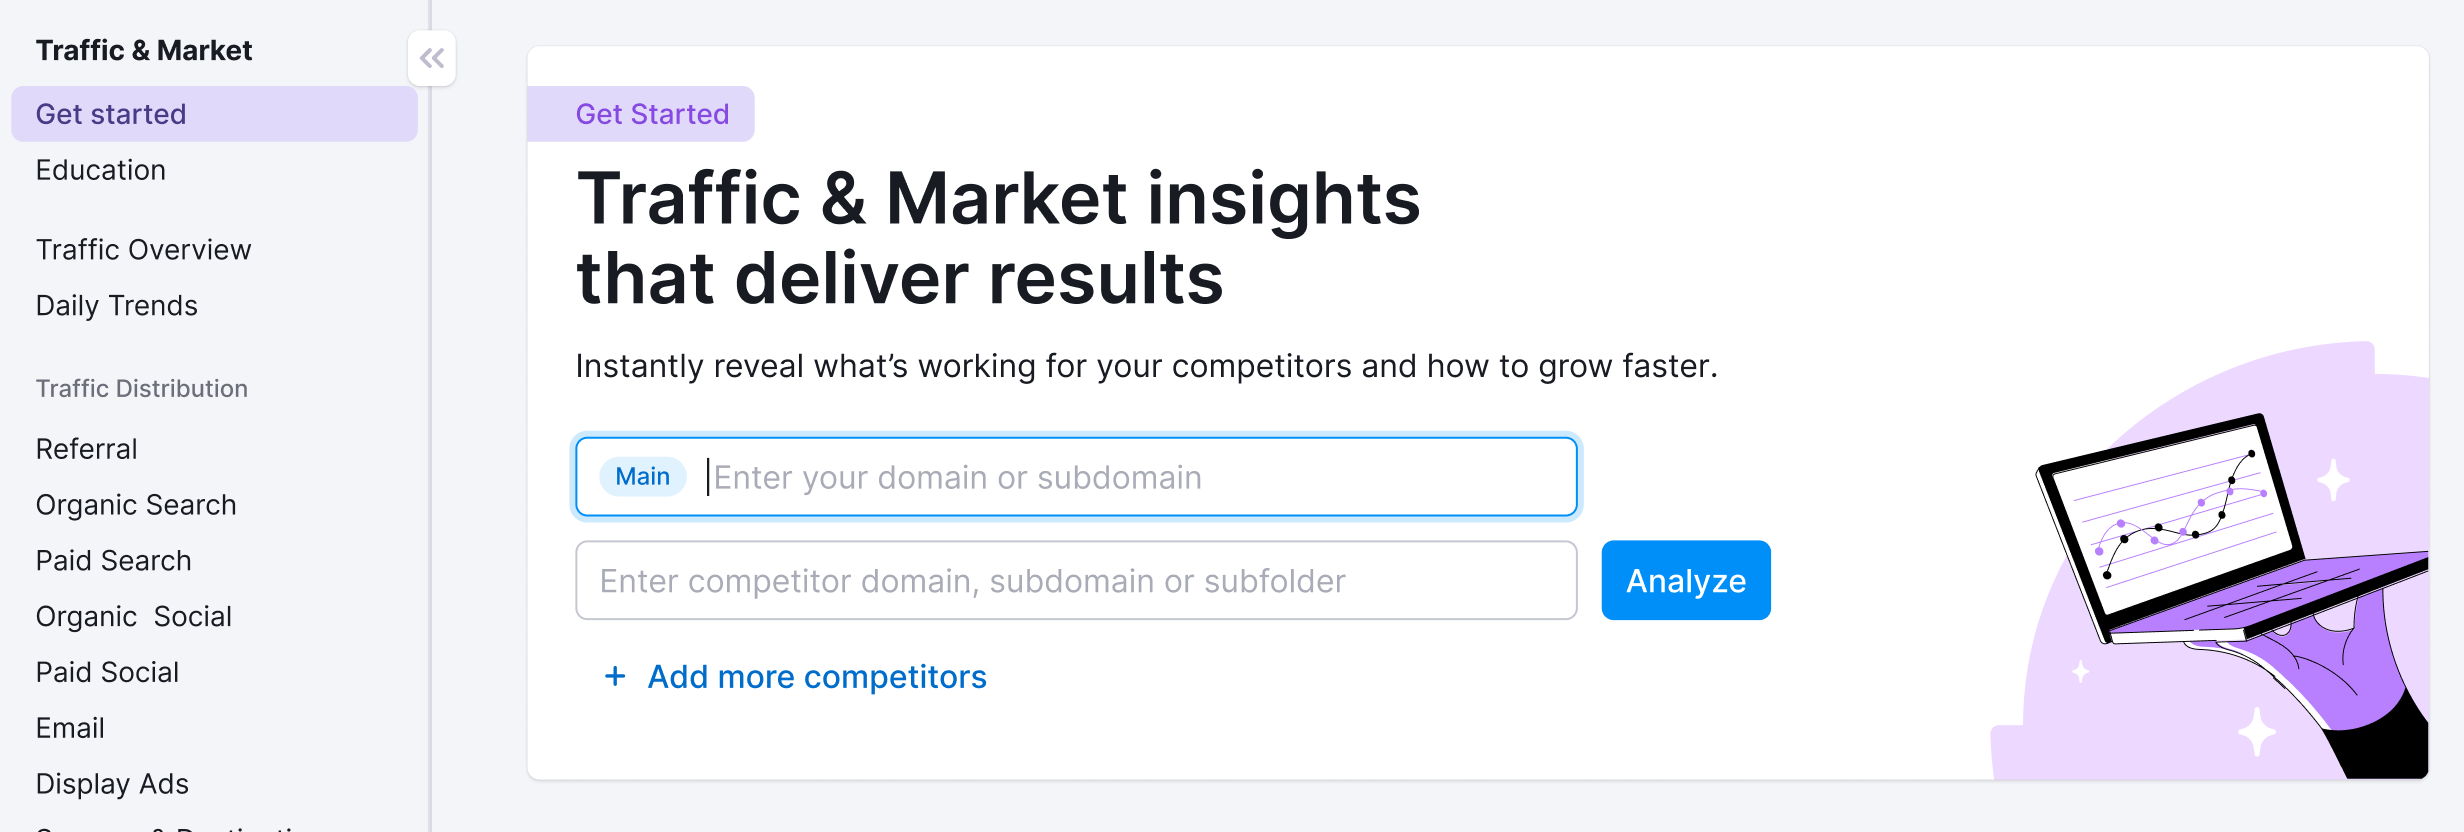
You’ll use this page to kick off your analysis—it’s your launchpad into the entire Traffic & Market experience.
If you haven’t created any projects yet, you’ll see a search panel where you can:
- Type in a domain — Start by entering the main domain you’d like to analyze
- Add additional competitors — Use the “+ Add more competitors” link to compare multiple sites at once
- Click the “Analyze” button — This will pull up dashboards with data and charts, starting with the Traffic Analytics dashboard
If you’ve already entered domains into the toolkit, you’ll see them saved as “Folders” and you can access them anytime.
In this case, you’ll see your saved folders listed on the Get Started screen. Click any one of them to jump straight into your dashboards and pick up right where you left off.
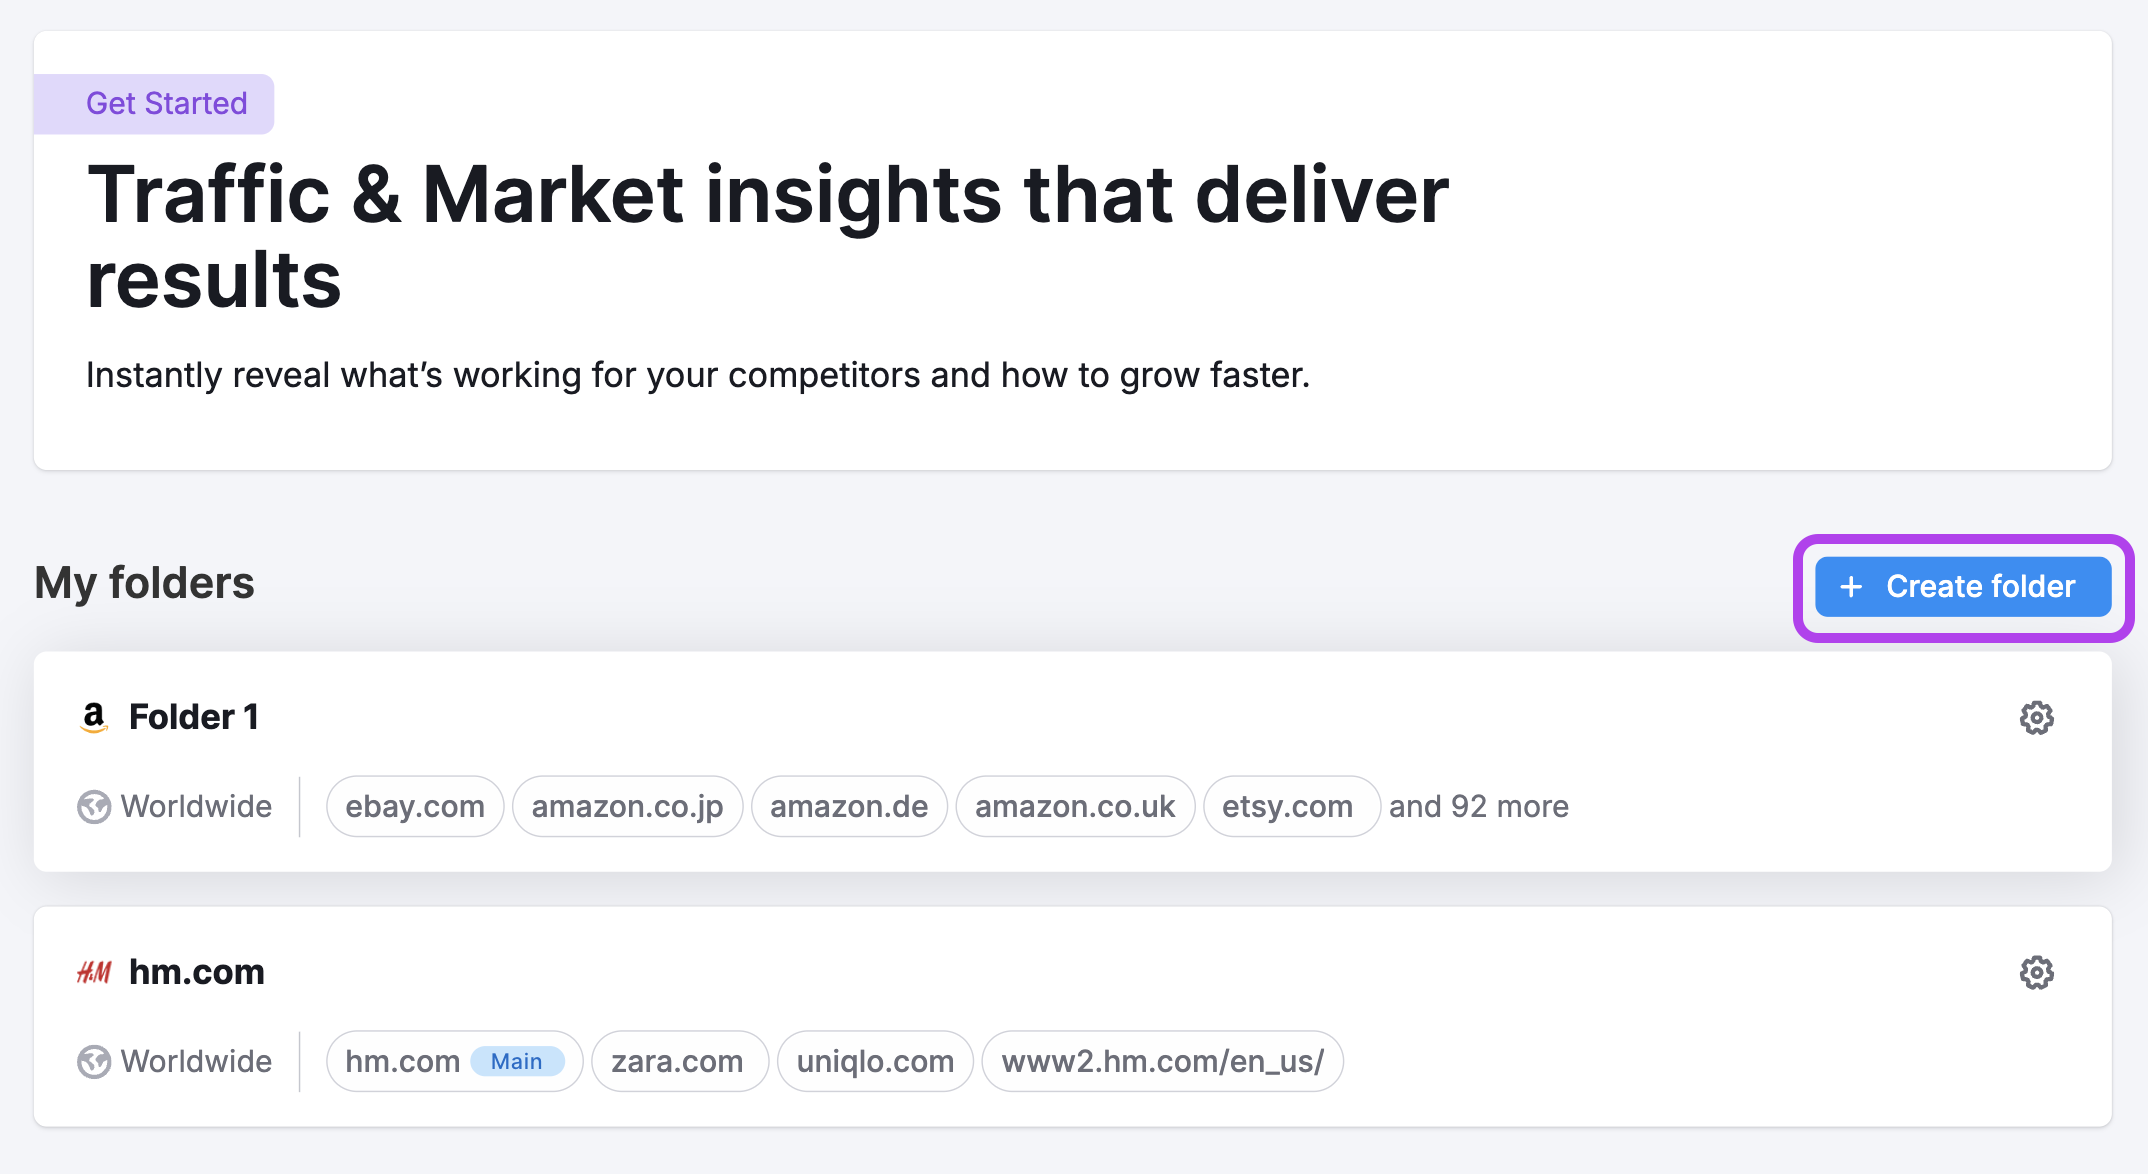
Use the “Create Folder” button to start a new project whenever you're analyzing a new domain or market.
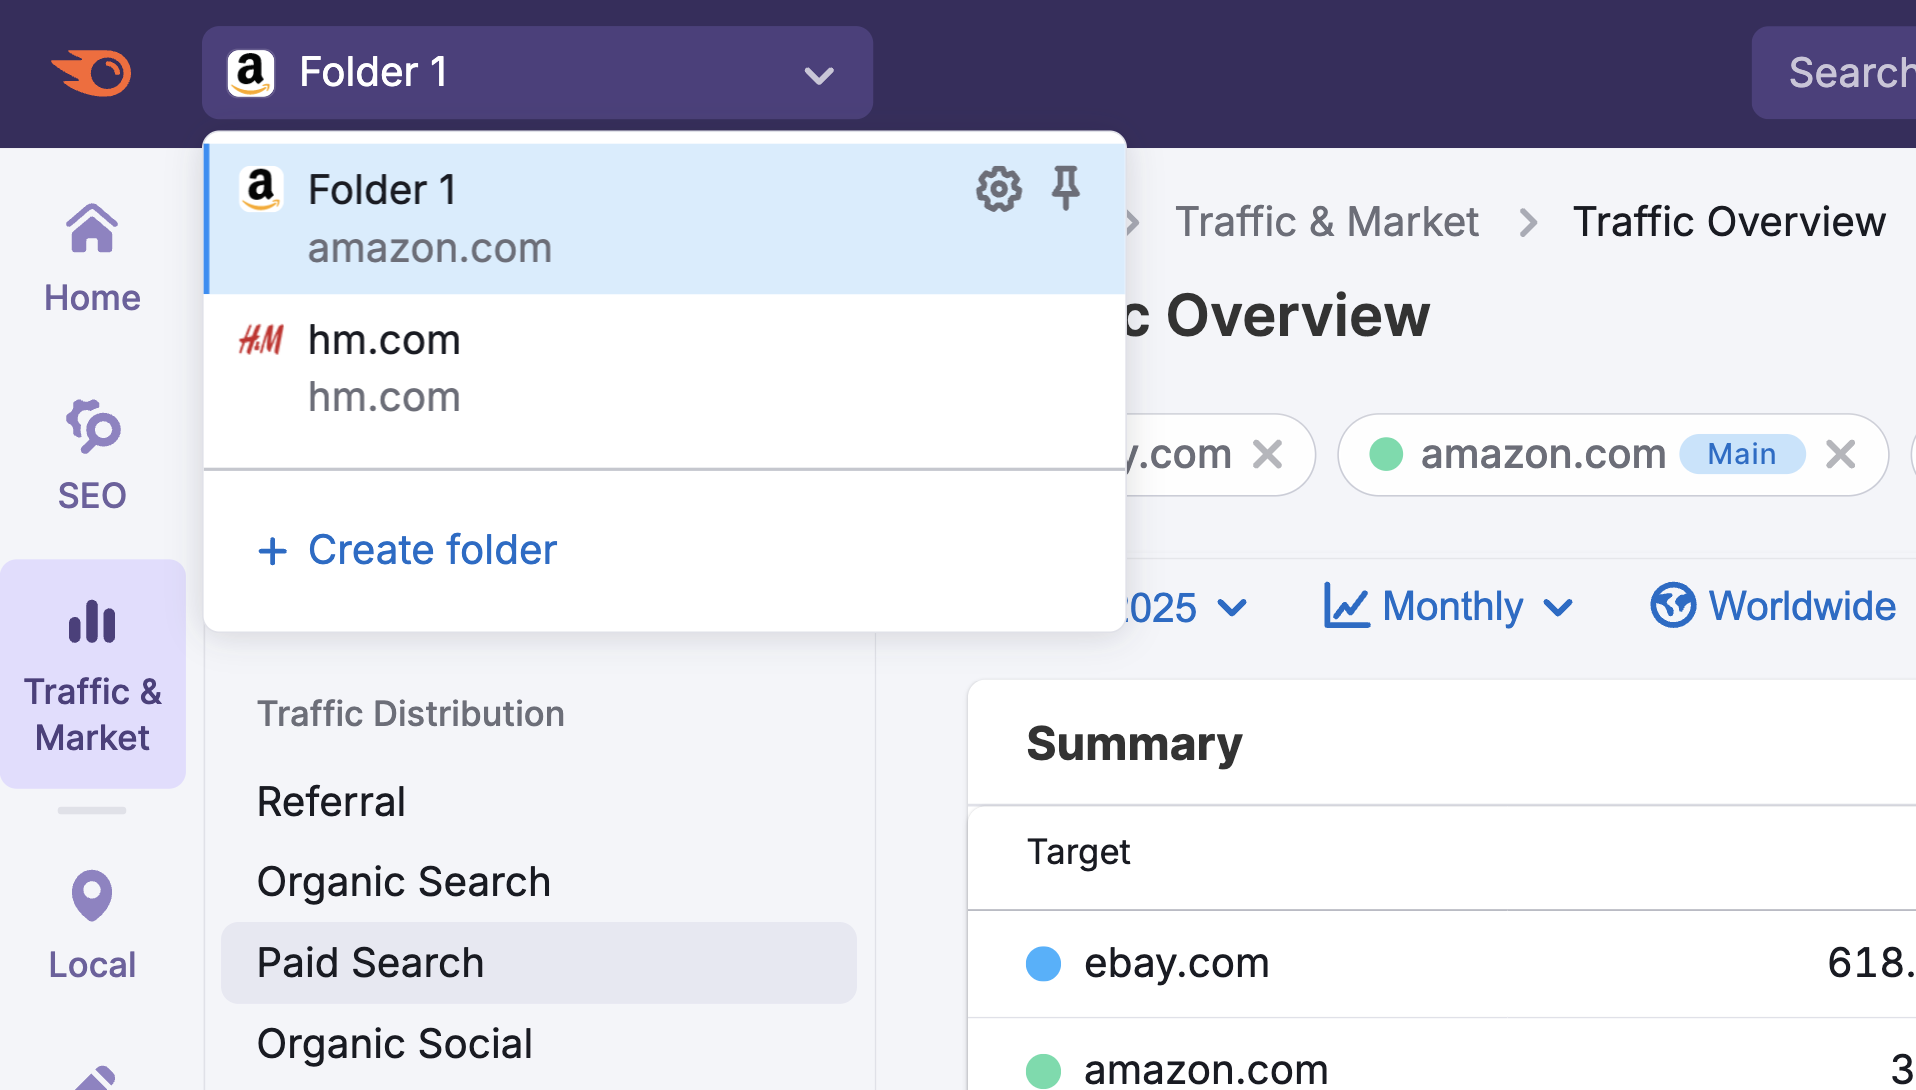
Note: At any time inside any dashboard, you can select the Competitor list drop-down in the upper left to edit your current list or create a different one without losing your place.
How to use the Countries dashboard
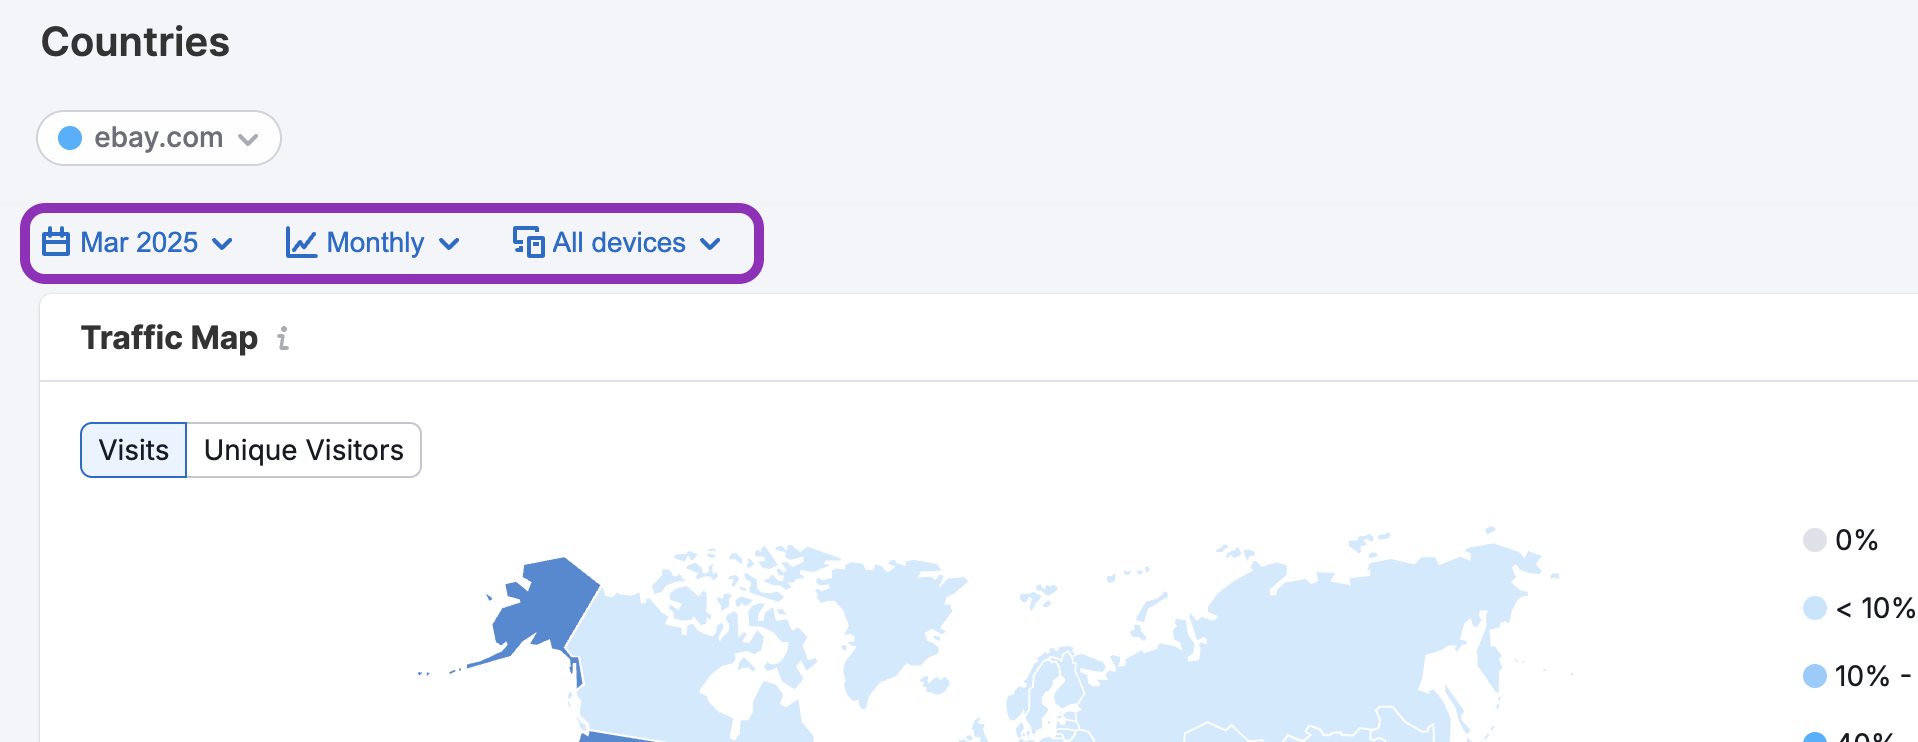
The Countries dashboard is interactive and customizable. Use the filters at the top of the page to tailor your analysis and explore traffic flows in detail. Start by selecting your date range, data granularity (daily, weekly, monthly, quarterly), and device type preferences.
At the top of the dashboard, you'll see the Traffic Map, a color-coded world map that shows traffic distribution by country. Hover over any country to see its traffic share and total visit count.
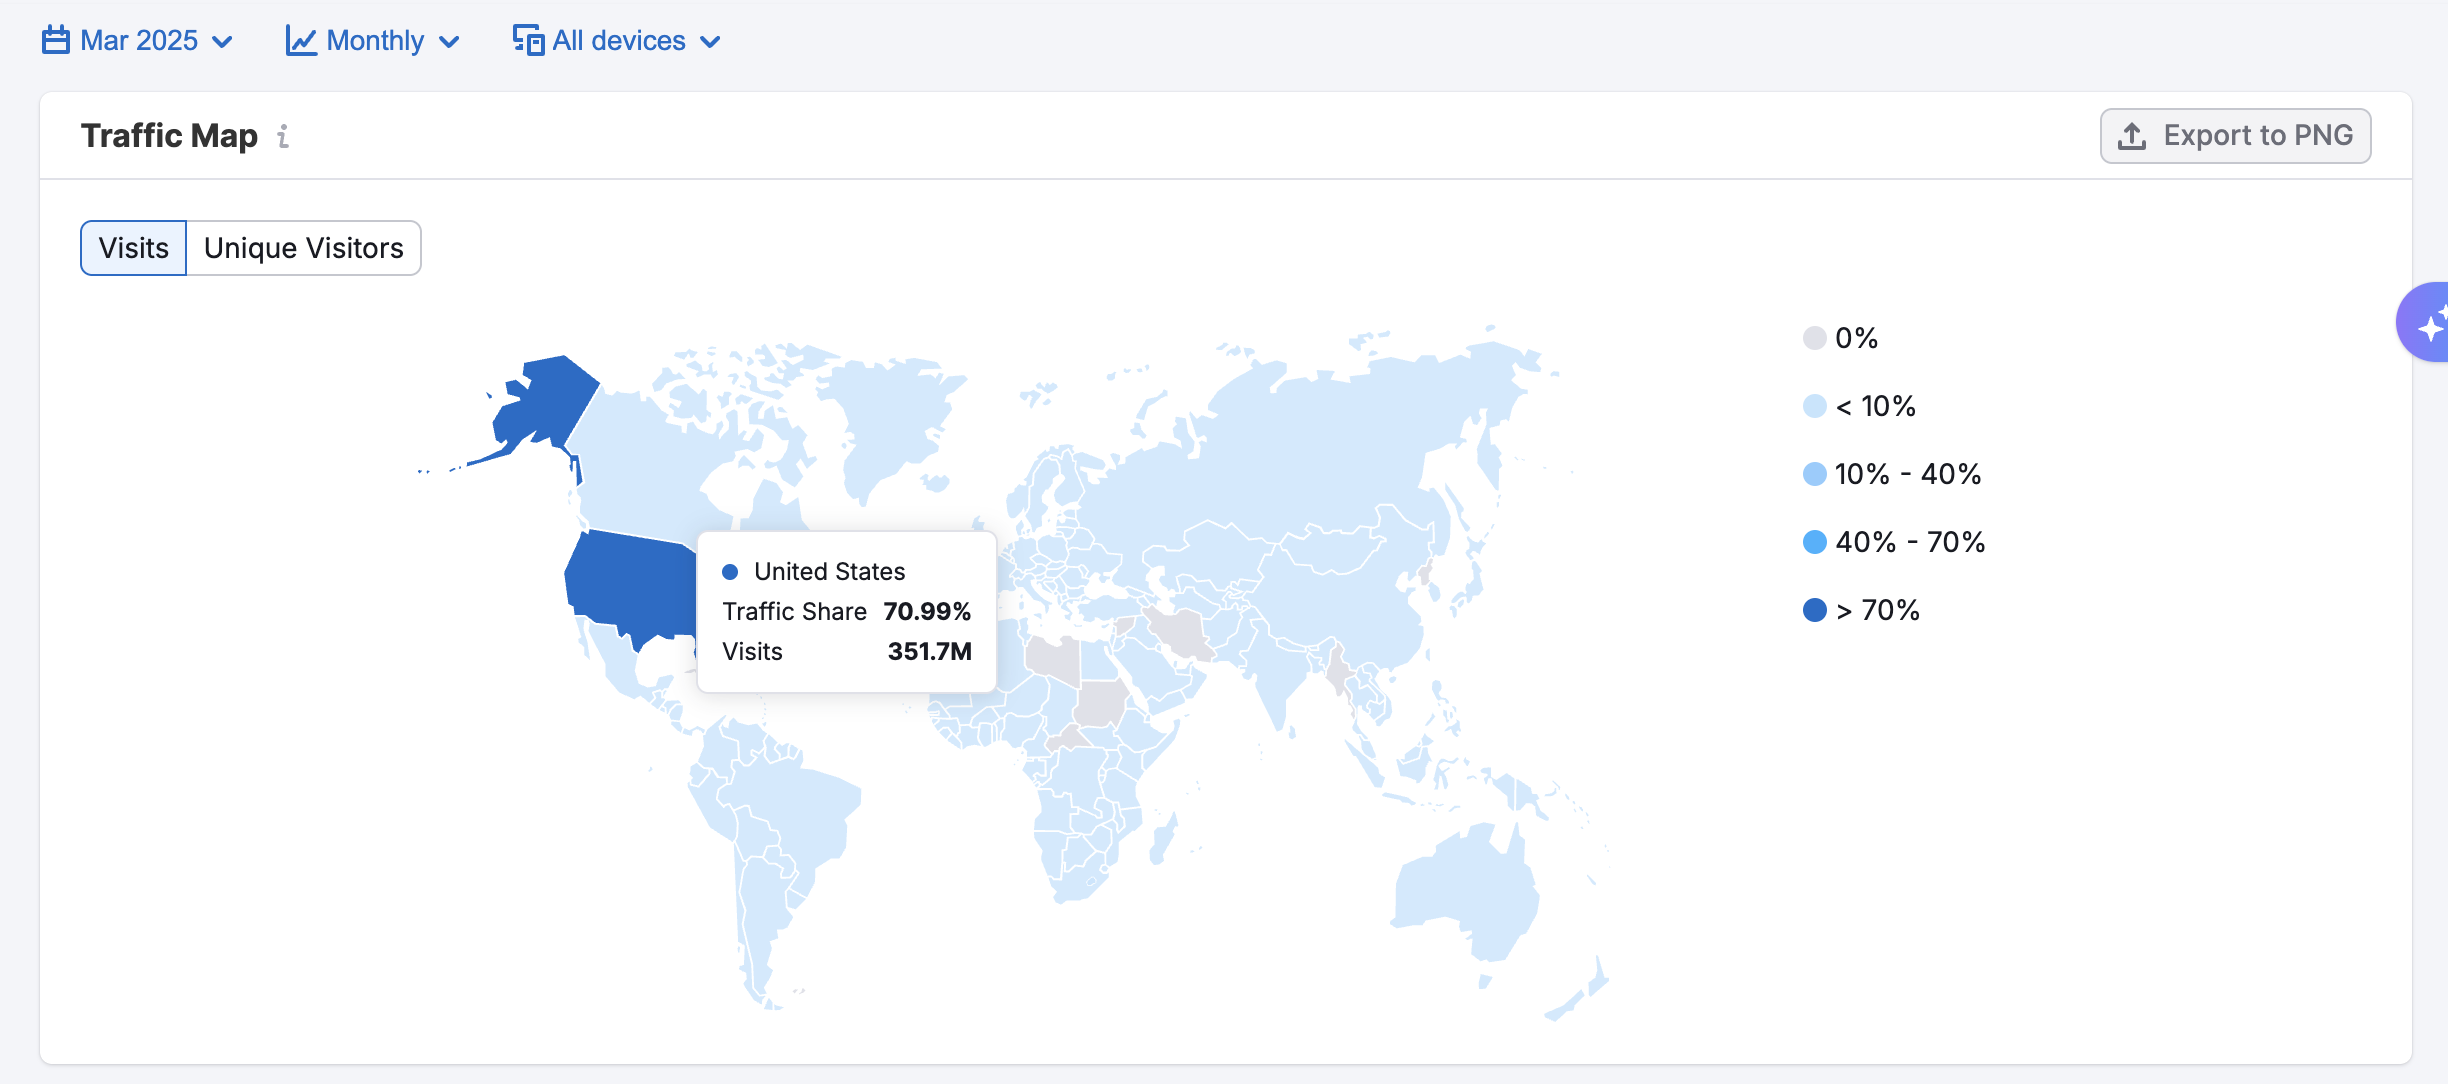
Darker shades indicate higher traffic volume, helping you quickly spot the most engaged regions. Hover over any country to show country-specific metrics. You can also toggle between Visits and Unique Visits.
Just below the Traffic Map, you’ll see the Traffic Trend graph—a line graph that shows how traffic from your selected countries trends over time.
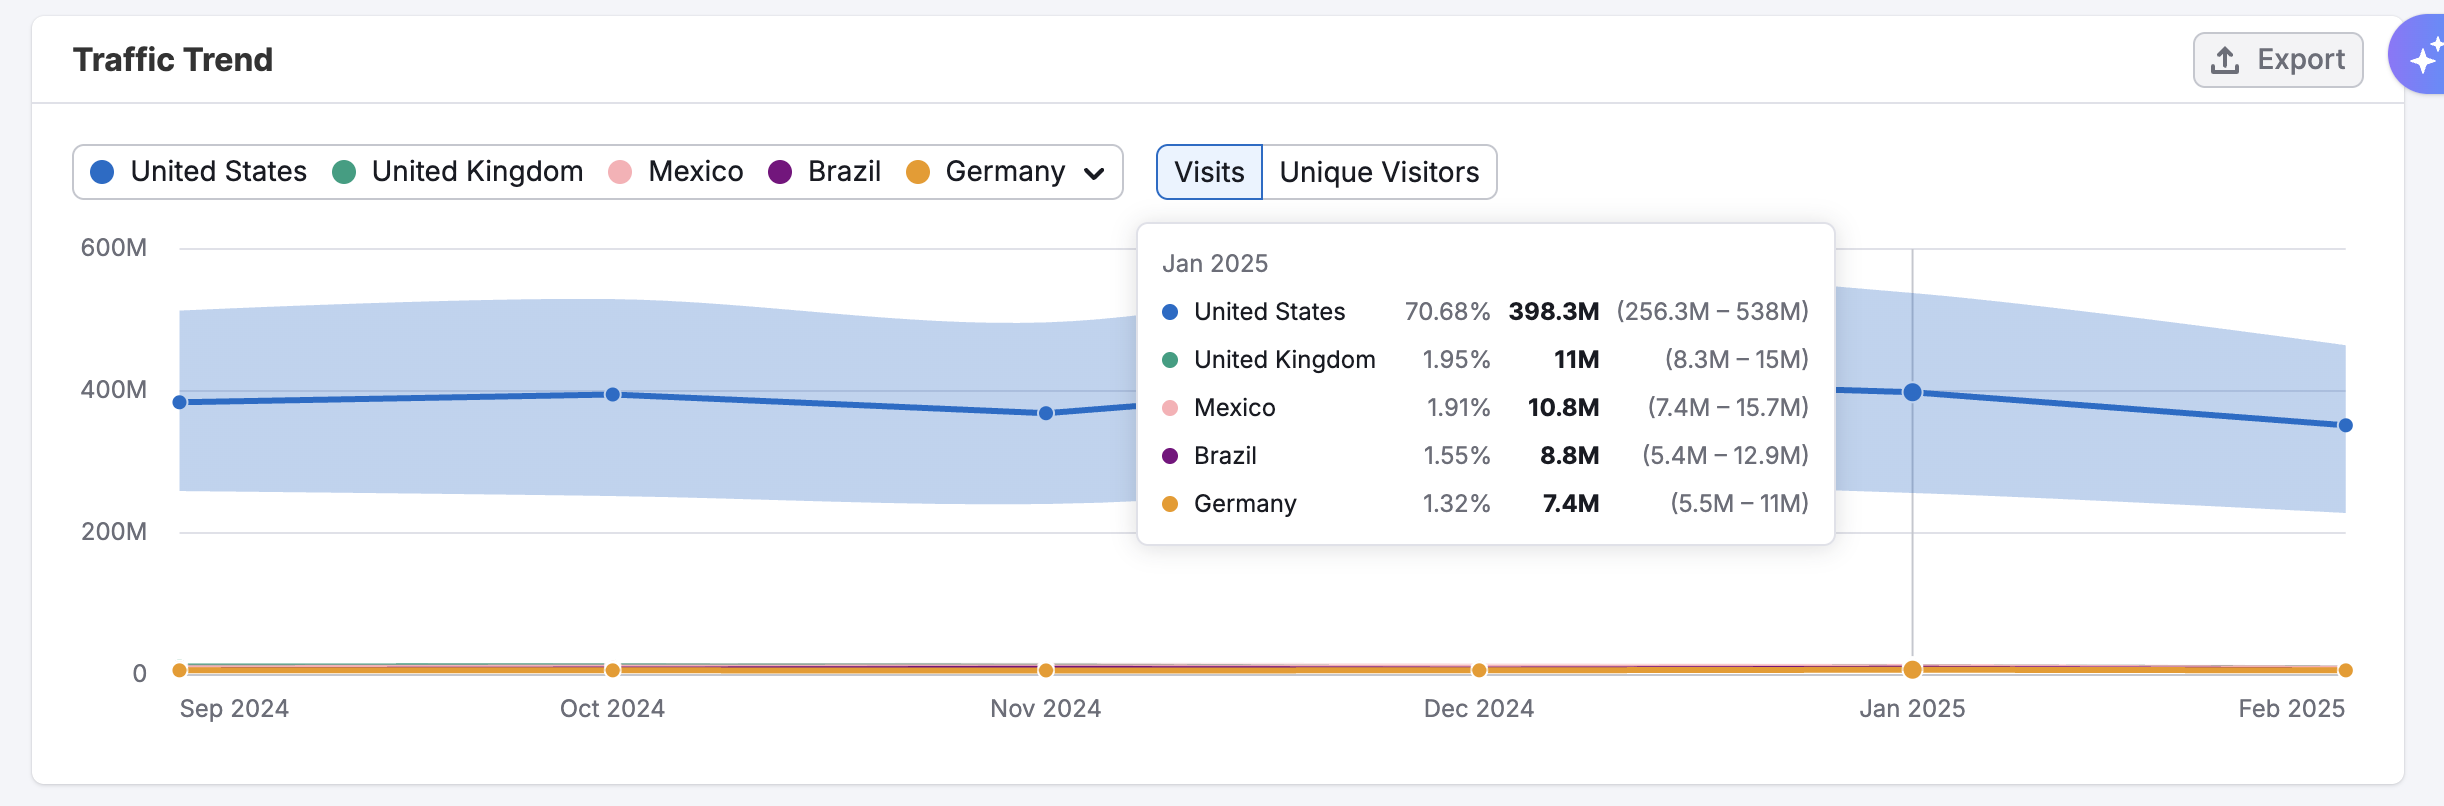
This graph makes it easy to track trends over time, revealing seasonal shifts or emerging changes in international performance.
Further down, the Traffic by Country table gives you a detailed breakdown of every country, including:
- Traffic share
- Visit totals
- Unique visitors
- Desktop vs. mobile split
- Pages per visit
- Average session duration
- Bounce rate
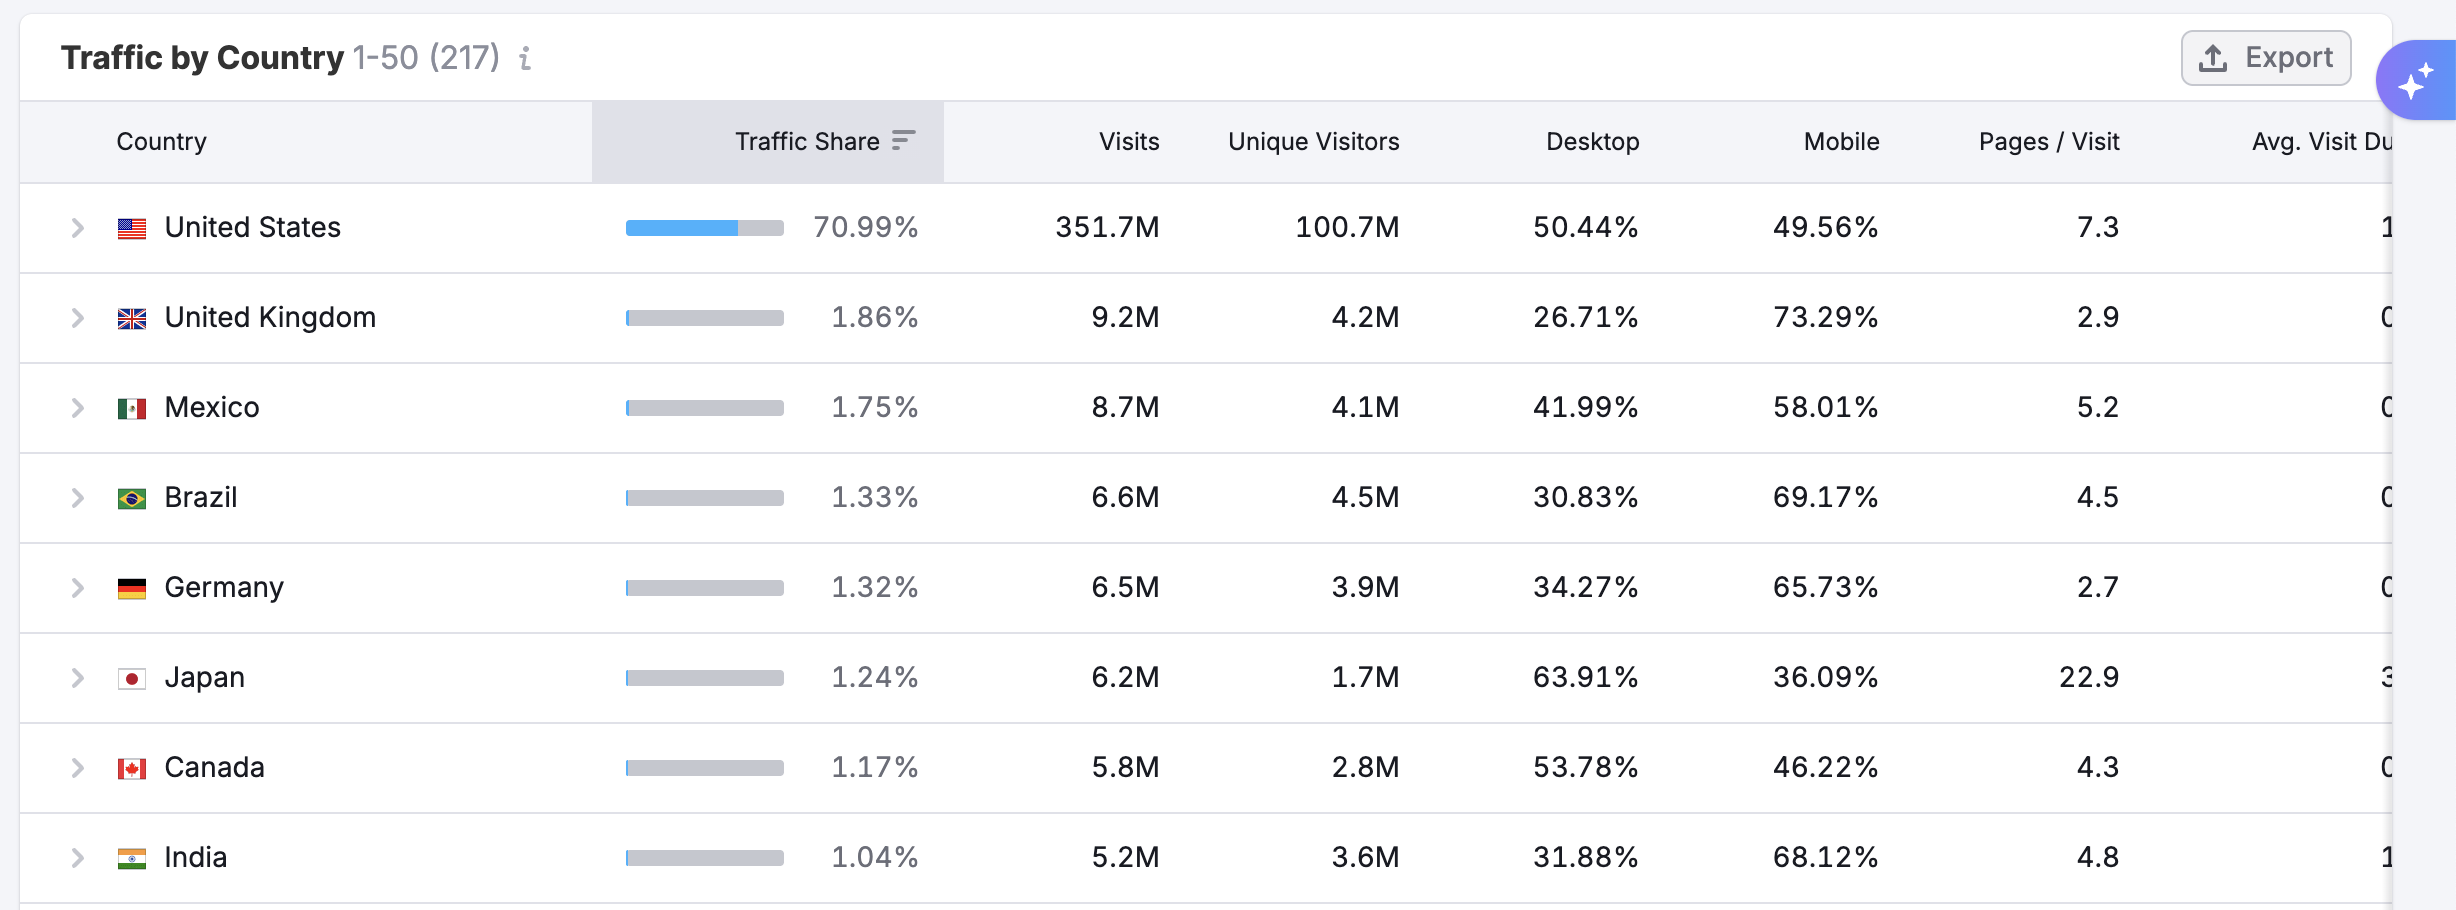
You can sort the table by any column to highlight the most relevant metrics for your analysis. Each row in the table includes a dropdown that expands to show the top pages visited by users from that country.
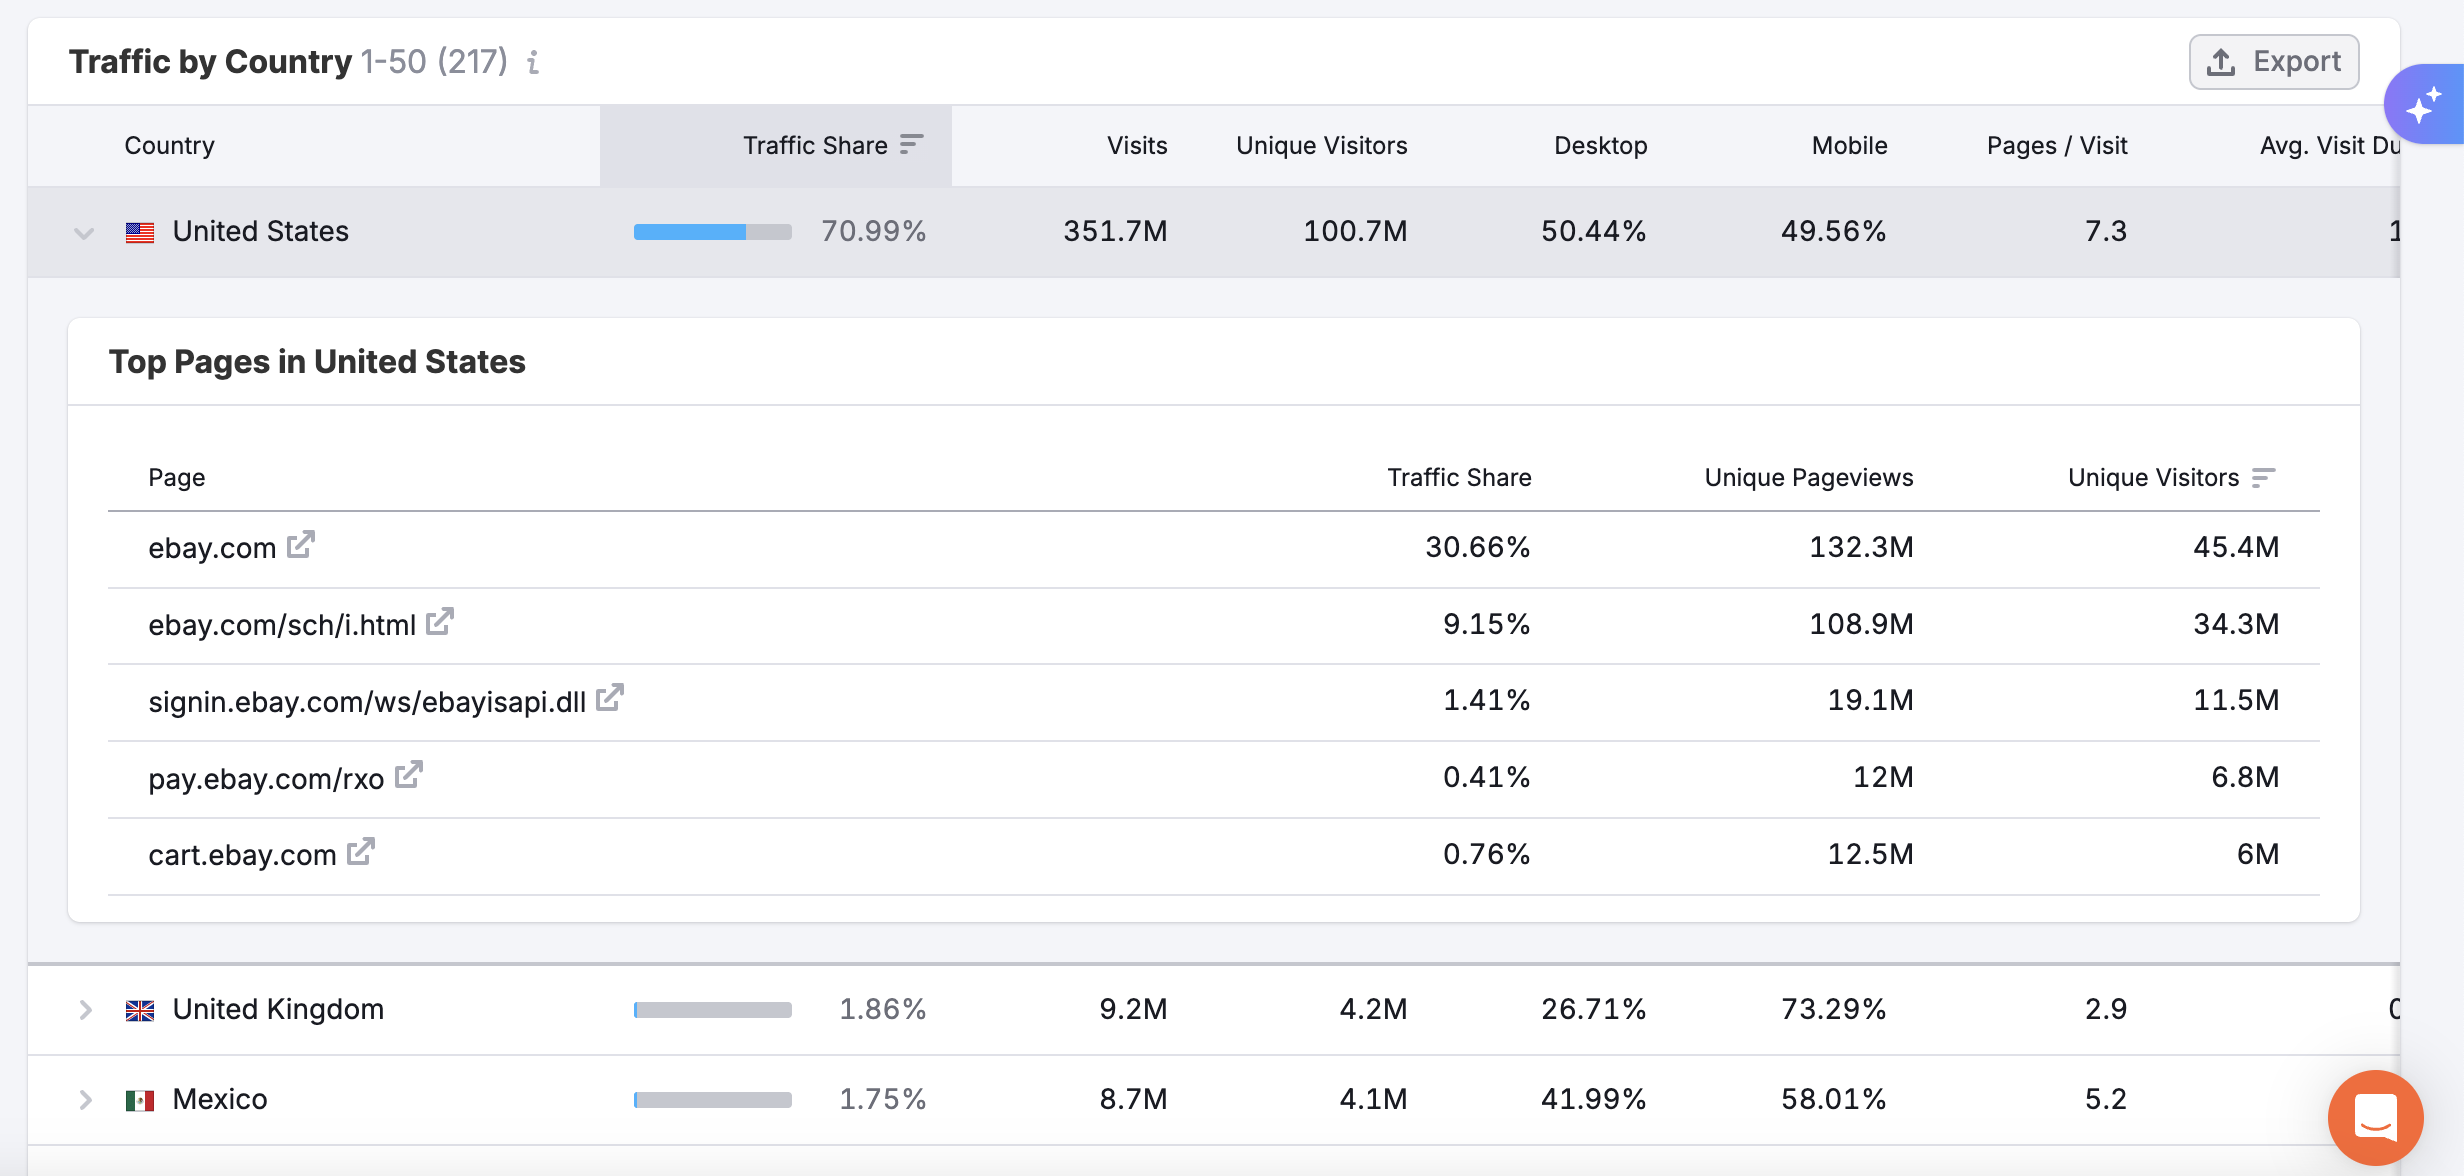
You’ll see URLs, traffic share for each page, and visit or visitor counts—giving you a page-level view of what content is resonating in different parts of the world.
Use this dashboard to analyze where your competitors are gaining traction, uncover global patterns, and refine your own international marketing and content strategy.
What can I do with these insights?
The Countries dashboard is built to support competitive research and global market segmentation. Here are a few ways to put the data to work:
- Benchmark international performance: See where competitors are strongest and where you might have an opportunity to grow.
- Spot regional demand: Identify countries with the highest interest in your competitors’ offerings—and plan campaigns accordingly.
- Analyze international engagement: Compare how user behavior (like pages per visit or session duration) varies by country.
- Localize your strategy: Use traffic and content performance data to inform SEO, advertising, or partnerships in key regions.
These insights help you refine your global marketing efforts by learning from where your competitors are gaining traction.
What other dashboards support geographic insights?
Combine Countries with these related dashboards for a full view of location and audience trends:
- USA Dashboard – for state-level performance within the U.S.
- Business Regions Dashboard – for regions like LATAM, APAC, and EMEA
- Demographics Dashboard – for sex, age, and other characteristics
- Top Pages Dashboard – to see which competitor pages perform best
- Traffic Analytics Dashboard – to explore full traffic metrics at a glance